PostProcess: plot interaction and Images
After compute the FEM solution values we will show how to interact with a plot in Matlab
Contents
Select points in a plot window
Matlab allows you to use the mouse and select a point. It gives you the coordinates of this point. The involved function is ginput
One element example:
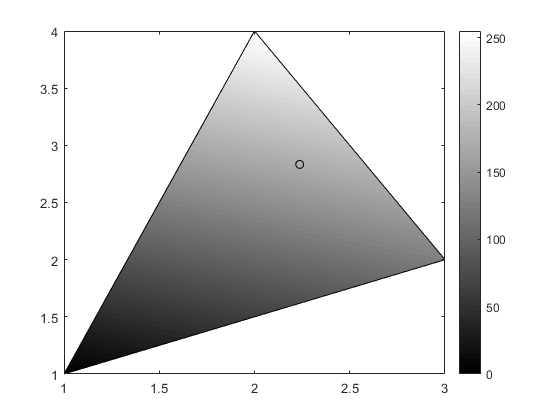
We plot a gray triangle and choose a point using the mouse. The result is saved as an png image that we will load later.
nodes=[1,1;  %define the nodes of a triangle
    3,2;
    2,4];
elem=[1,2,3]; %define the triangle it self as an element
X=nodes(:,1);
Y=nodes(:,2);
values=[0;128;255]; %can be temp., stress, etc.
fill(X,Y,values);
colormap('gray') %one of the standar color maps for FEM
colorbar %it is optional, shows the bar with the color scale
%
% select a point on the plot window using the mouse
%
%
[px,py]=ginput(1); %we choose only one point
p=[px,py]; %consider these coordinates as a point
hold on;
plot(p(1,1),p(1,2),'ko'); %plot the point using black o
hold off;

show the point on the command window
fprintf(1,'Selected point=(%f,  %f) \n',px,py); % fileOut=1 is the console
% print current plot in a file as a png image (you can use other image formats)
% (see doc print for more details)
print('grayTriangle','-dpng'); %saves current plot as a png image
Selected point=(2.237395, 2.832944)

Load one image to Matlab
Matlab allow us to load an image in several different formats. The main functions are imread and imshow
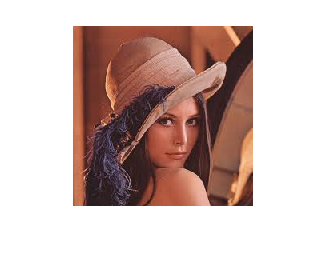
Let's start with one exemple
ourImage=imread('lenaRGB.png');
[m,n,depth]=size(ourImage);
%notice that it is a 225x225x3 matrix of uint8 (unsigned int of 8 bytes)
imshow(ourImage); %show the image in a window
[m,n,depth]
ans =

   225   225     3
We can ask for the colors of one pixel
%RGB values for pixel 100, 60
r=ourImage(100,60,1);
g=ourImage(100,60,2);
b=ourImage(100,60,3);
[r,g,b]
% or you can use: ourImage(100,60,:)
ans =

  1×3 uint8 row vector

   126    53    44
Interpolation color
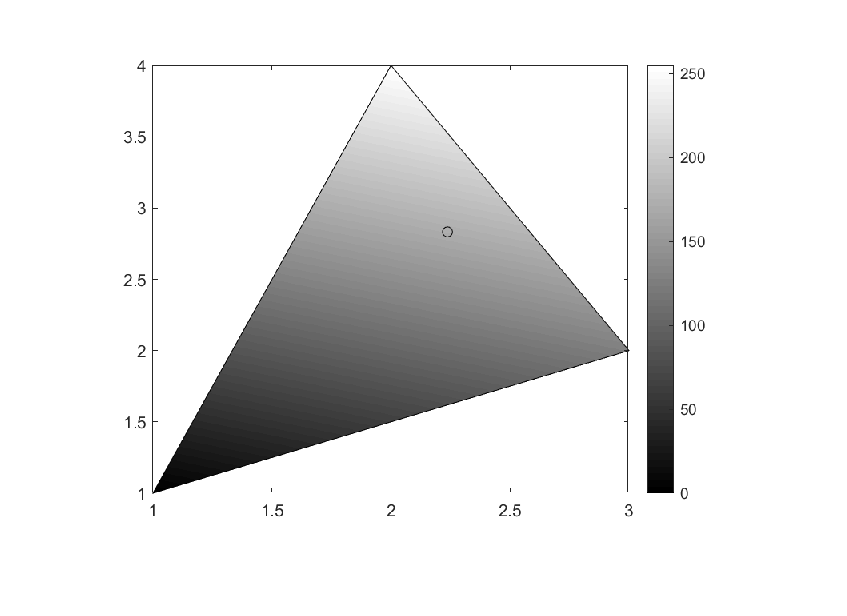
Let's take now our gray triangle image. We will check the color of a point. In the case of the selected point the value must be the interpolated value of the vertices in this point.
ourImage=imread('grayTriangle.png');
imshow(ourImage);
%
% Now select the Data Cursor icone on the plot window (see the figure)
%
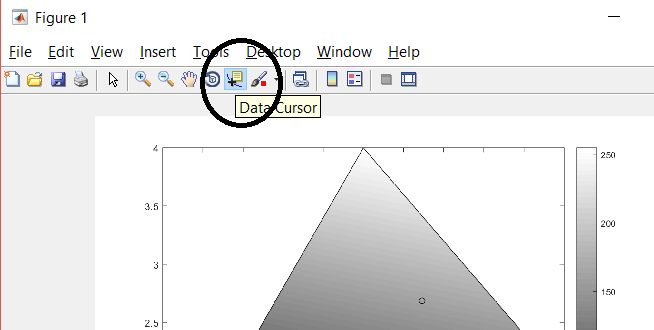
Use the cursor to get information about the point
%hold off;
%
% Finally move the cursor to the circle and get the color data
%
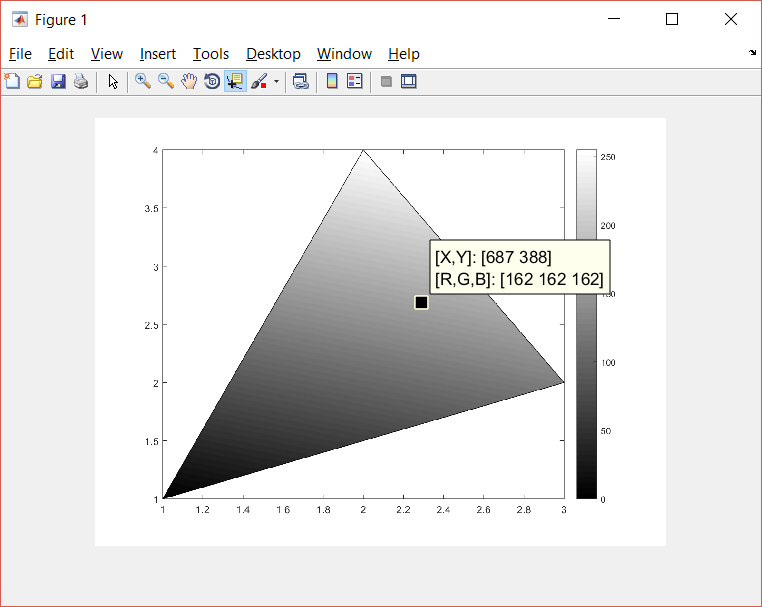
%imagValue=162; %value for Gray color in the image
Exercise:
Consider the selected point p (it depends on your previous selection), and the values for the vertices we have used, colorVal=[0;128;255]
Compute the barycentric coordinates and interpolate the color value in p. You have to obtain the same color value of the pixel selected in the previous step.
(c)Numerical Factory 2018